
5 reasons to write documents in R.

Writing documents using R code...it might sound crazy, but there are so many things R can do that Word and Google Docs simply can't. Here we cover the top 5 reasons you should switch to R for writing papers.
If you've completed some of the other guides, you should already be familiar with R Scripts - they're a type of file we use to write R code, which we then execute in the Console. There's another type of file though - RMarkdown - and this is what we use to create documents in R. When we're done, we can easily export the document to PDF or HTML to share with others (or Word, if you really must). The RMarkdown file type offers a plethora of features and benefits:
1. Reports are always linked to your data:
This is by far the most powerful feature of RMarkdown files. Whenever you use numerical values in your writing, exact values can be piped in directly from the data:
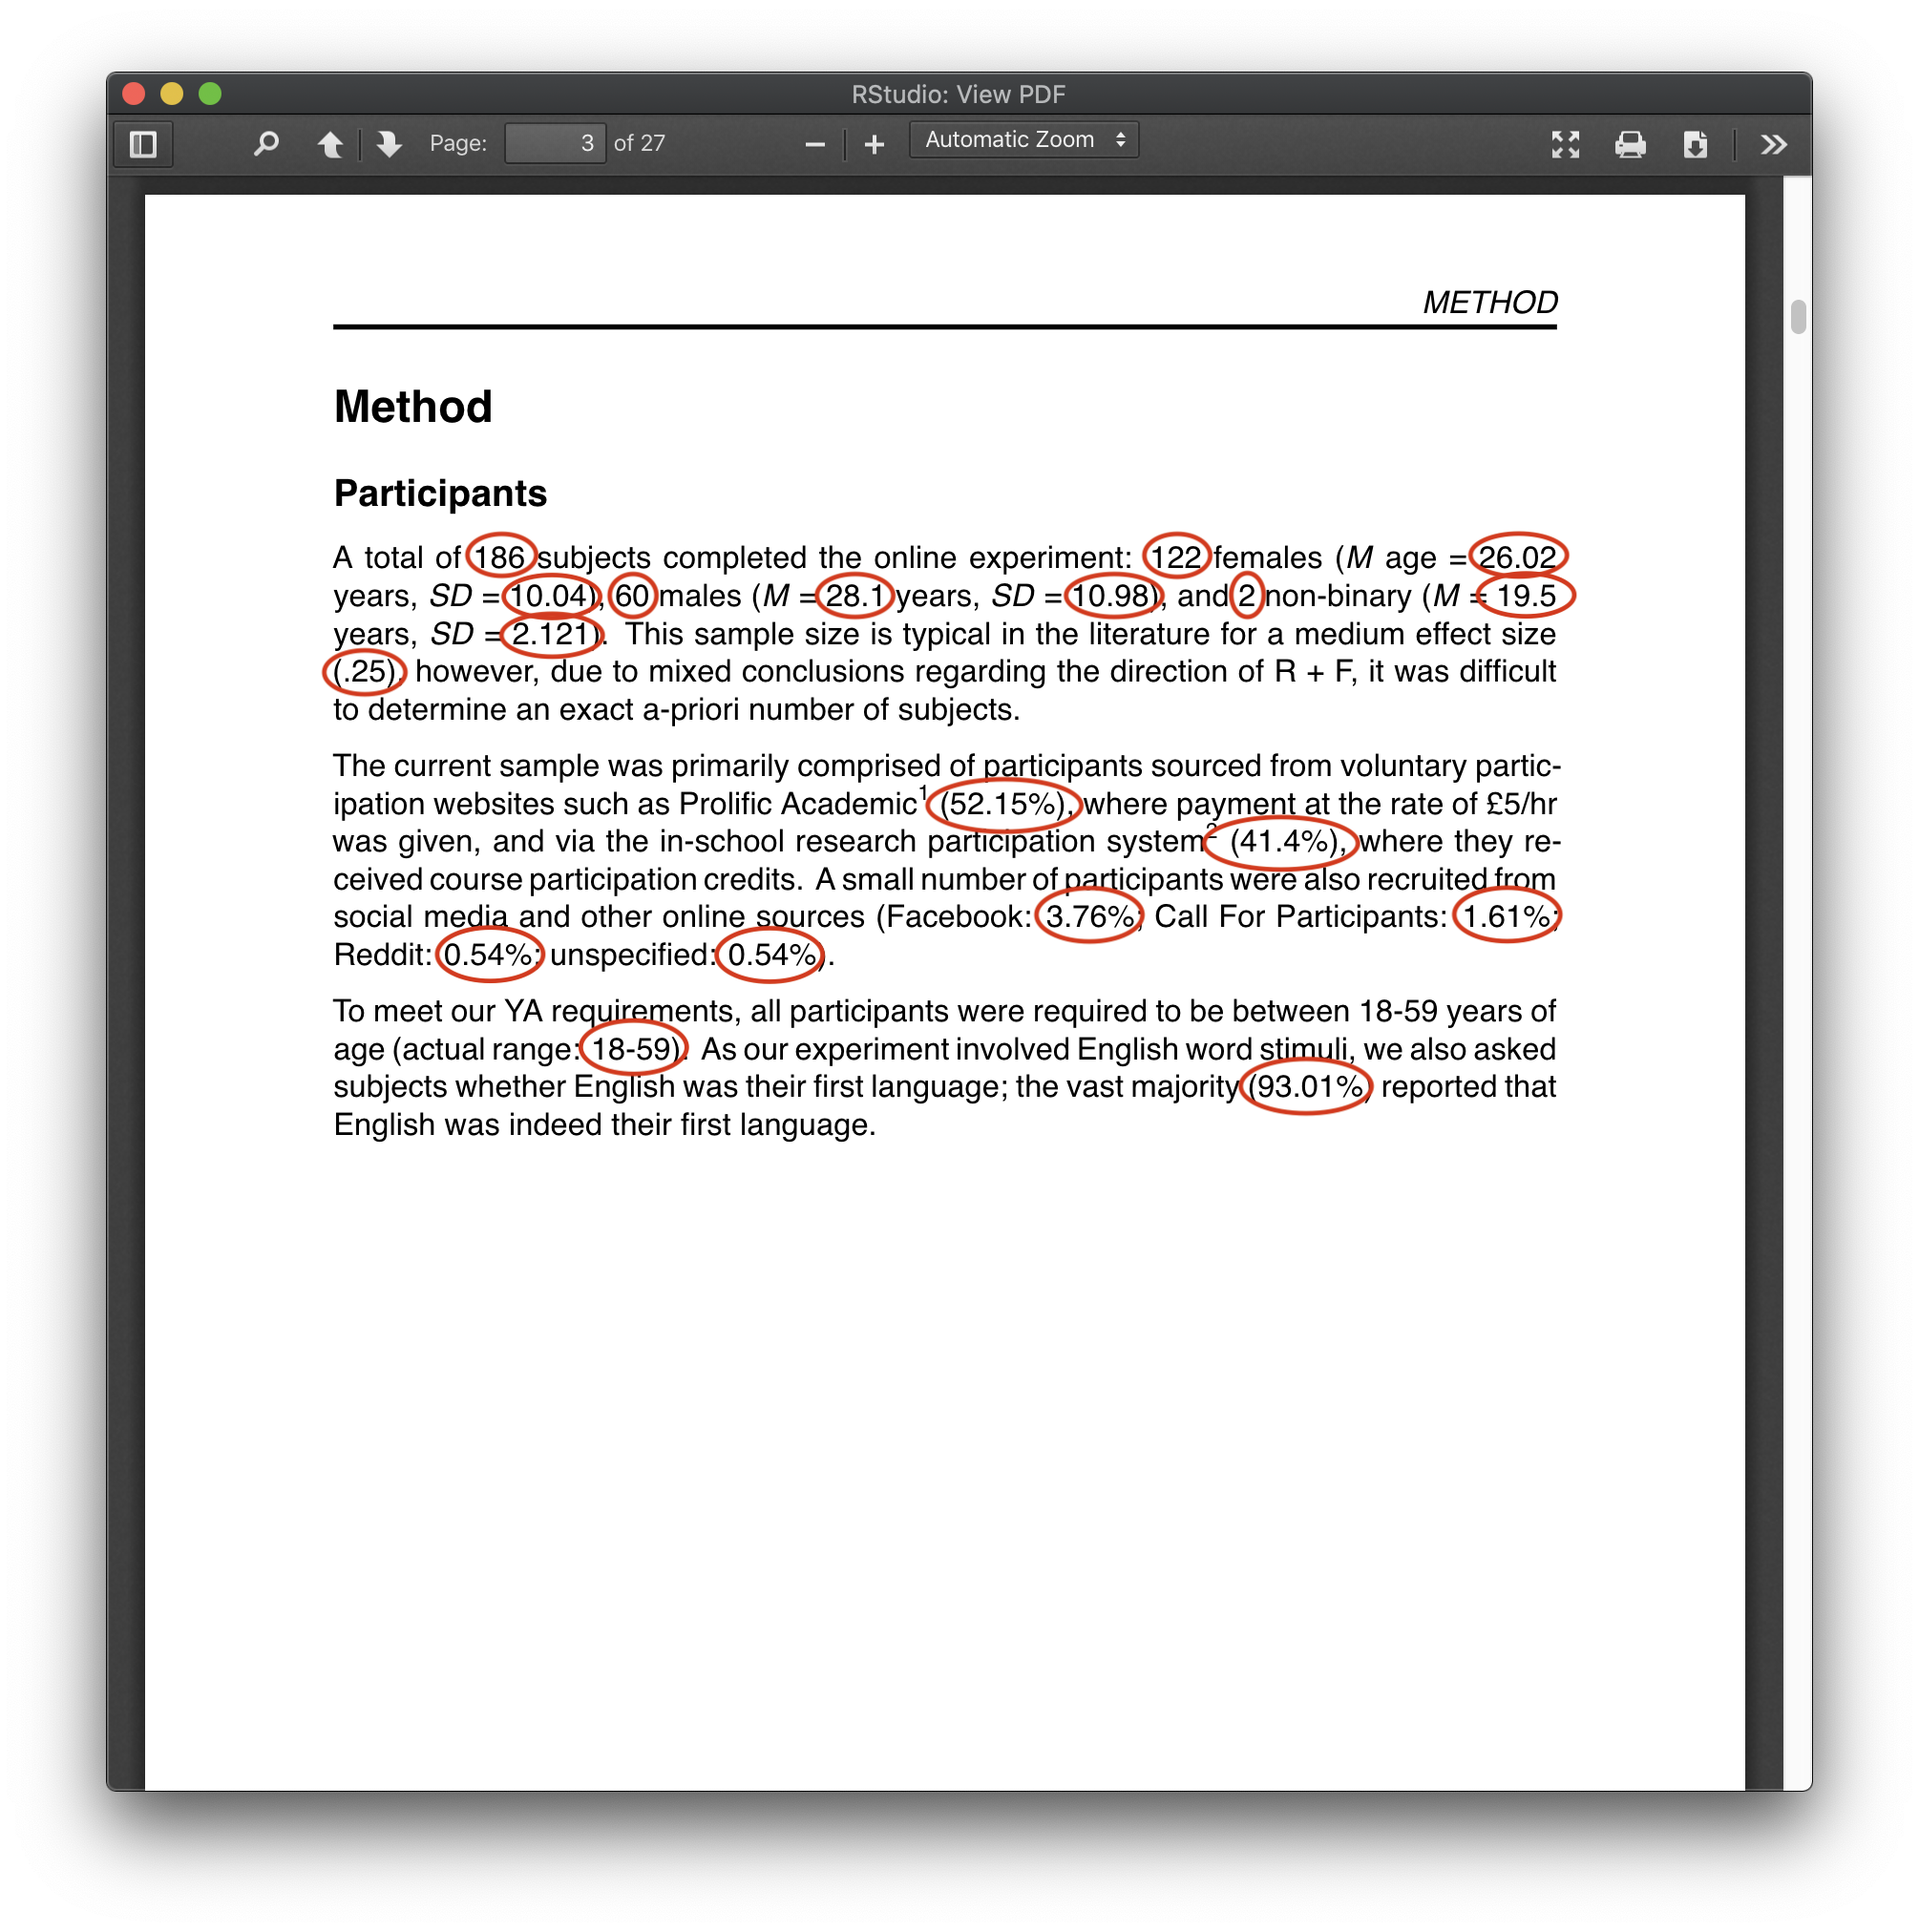
Take the above demographics section, for instance. Every value circled is piped directly from the data, so we never need to worry about its accuracy. If we make a change during analysis - maybe we add a bunch more data - no problem, it'll update all these values automatically!
This allows you be more descriptive of your sample and data, as you never have to worry about re-calculating things. Take the second paragraph, where the source of our participants is broken down into percentages. If we were to gain more data, it would be a real pain to have to re-caculate all of these again...now we don't have to.
There are even packages that write correctly-formatted analysis results for you (e.g. ANOVA results, again, directly from the data):
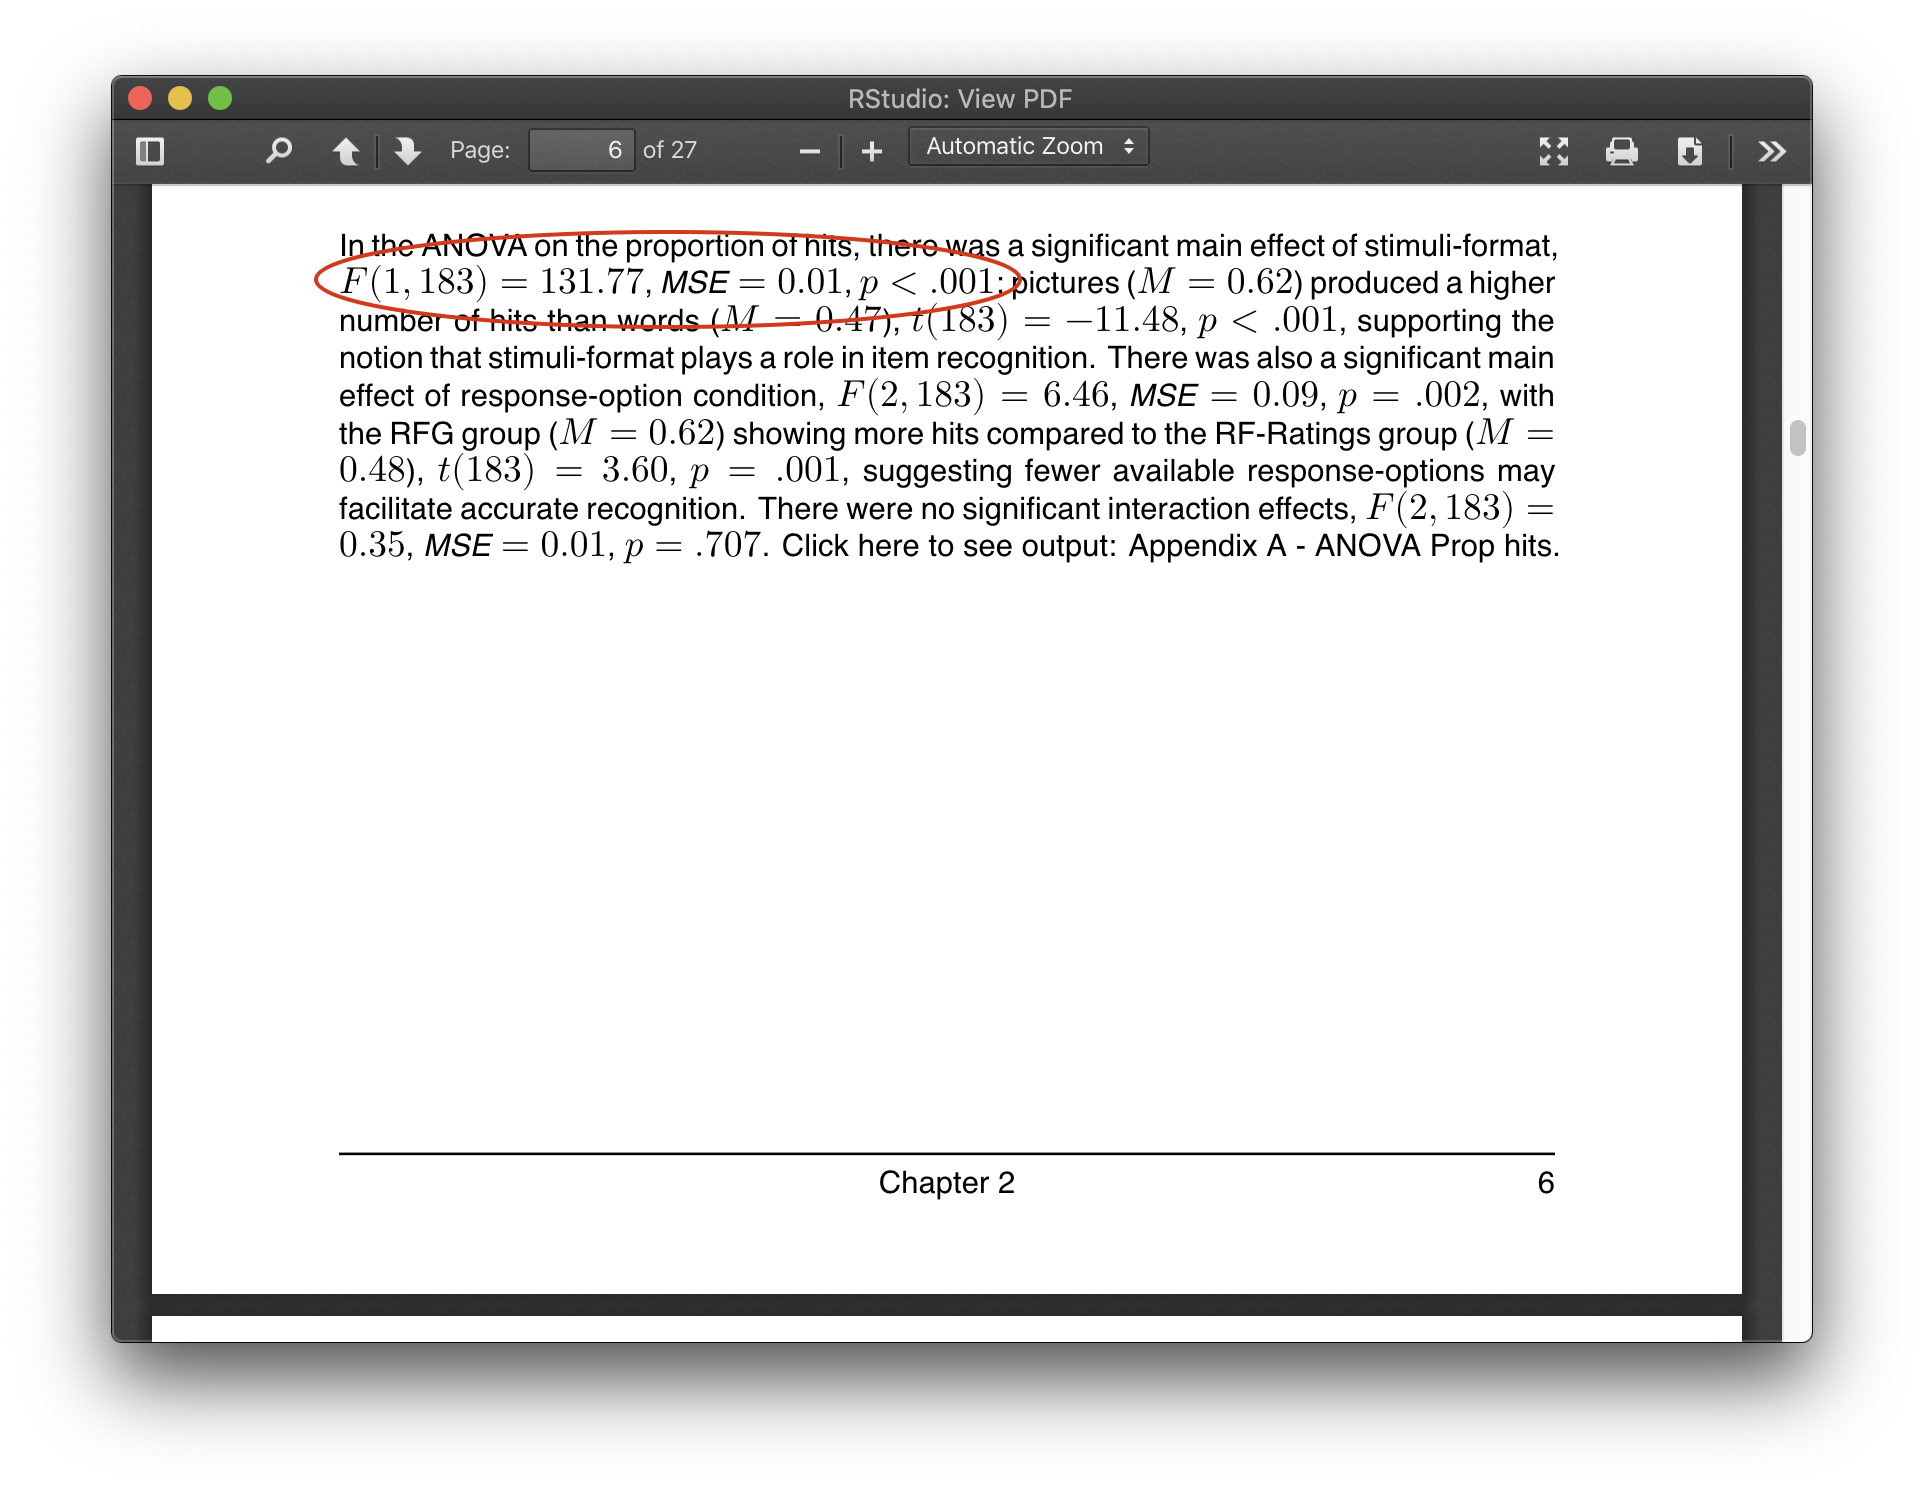
As well as giving you peace of mind that all of your values are accurate and up-to-date, writing your reports in this way is also great from an open science perspective. You can share your finished RMarkdown file with anyone; they will be able to view the final report, but also all of your workings (if you so wish) - from the first step of importing your data all the way to the write-up.
2. It can write references for you:
If you provide a RStudio with a .bib references library (I use Zotero, but there's also Mendeley etc.), along with a file that contains your desired formatting (APA, in my case), it'll do the rest of the work for you!
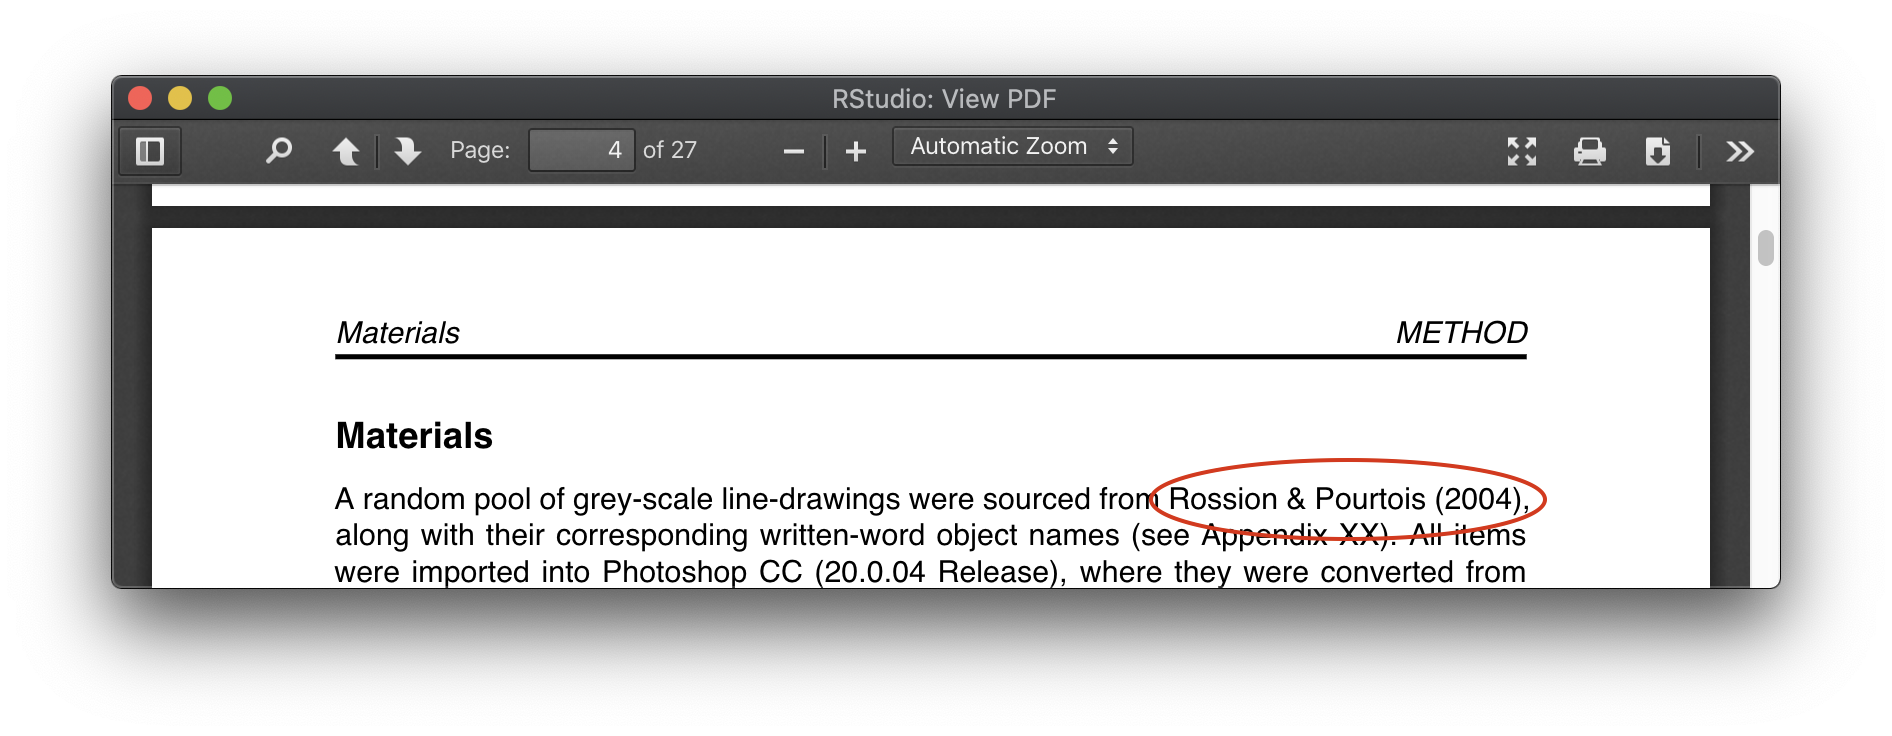
Your ref management software will have a 'citekey' next to each paper; this is usually the first authors surname and the year published. When used in RMarkdown like this:
A random pool of grey-scale line-drawings were sourced from @rossion2004,
...the correctly-formatted reference will be shown in your document:
Your references list at the end of the document will automatically be populated with any papers you cite in text:
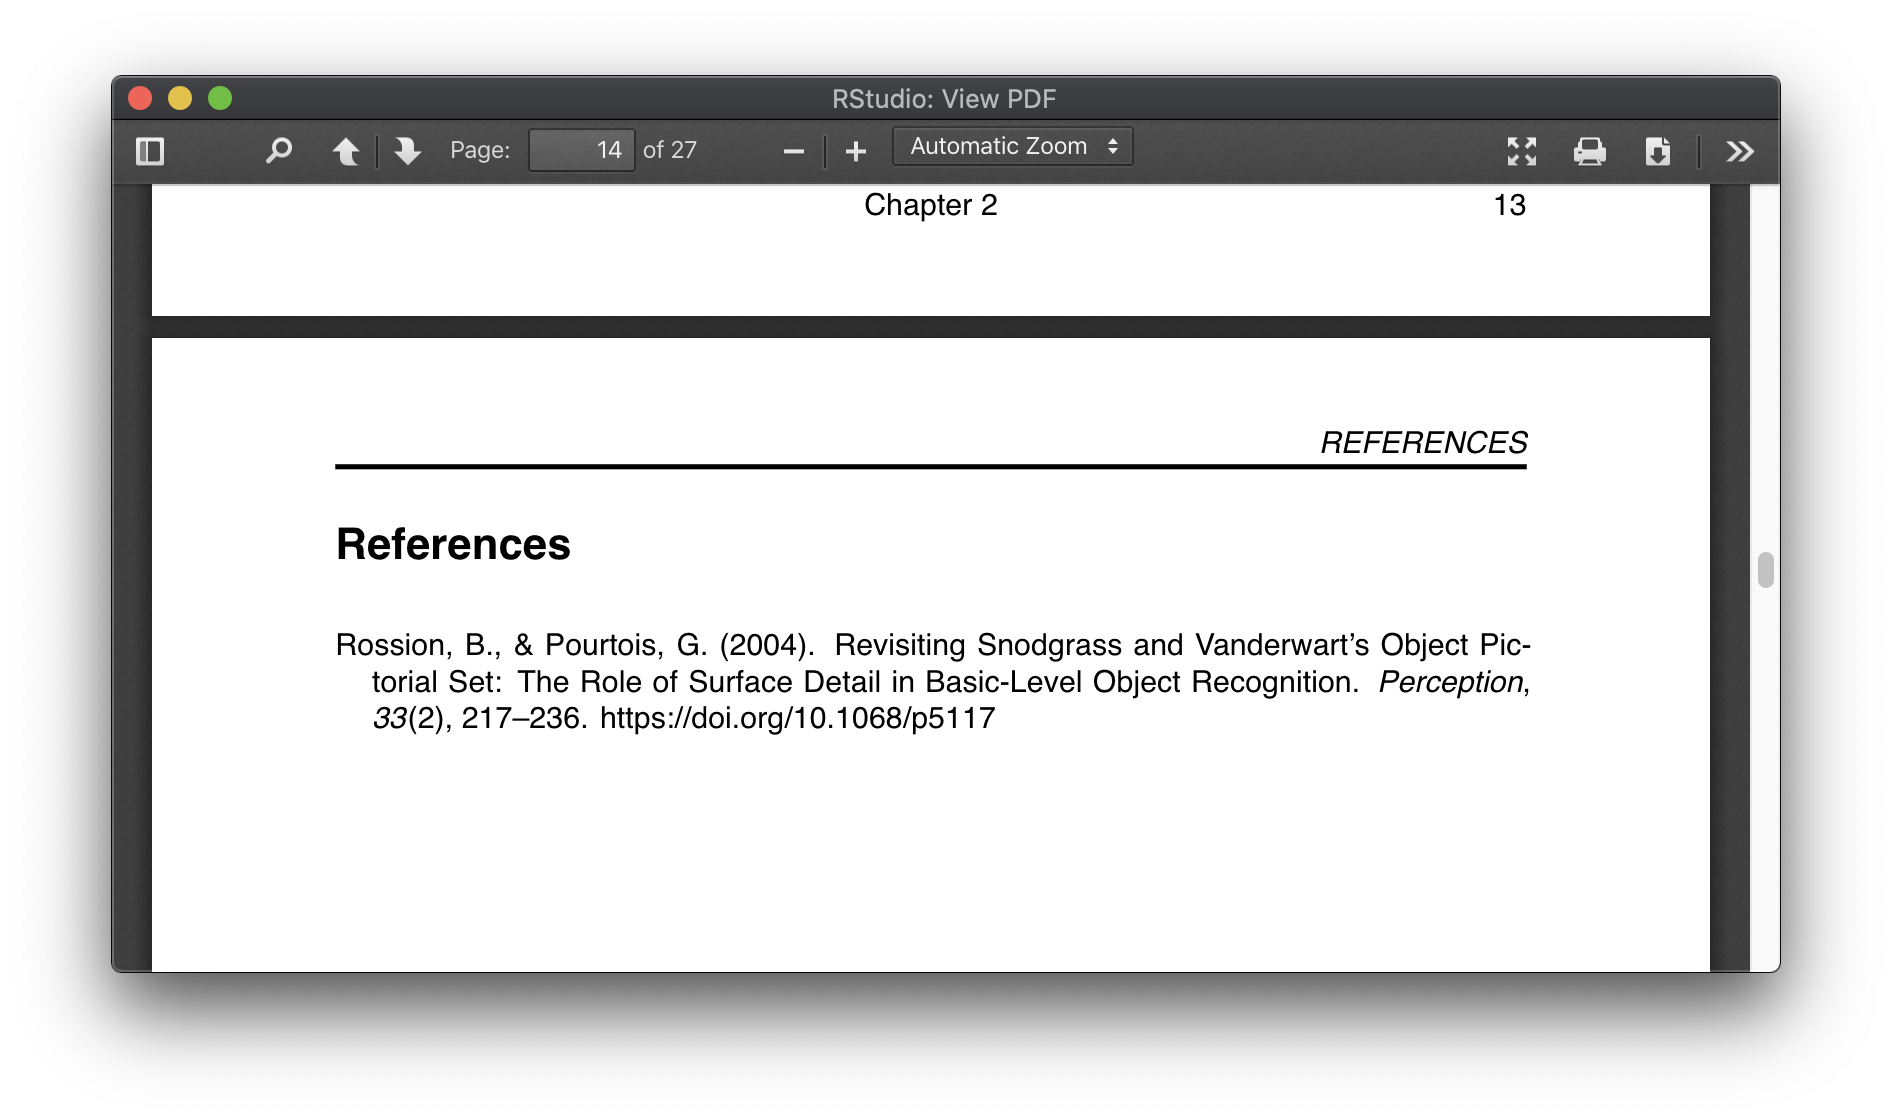
This is a huge time saver. Not only does it save you from having to manually type out your references, but it means you don't have to manually cross-reference your in-text references with your references list. If you make a change in-text, removing a reference in the process - it'll also automatically remove from your references list! This also means you don't have to 'curate' the references found in your ref management software. My exported ref library contains a lot of papers (not all of which are relevant to what I'm writing at the time) - but that's fine, as only the ones we cite will be shown in the document.
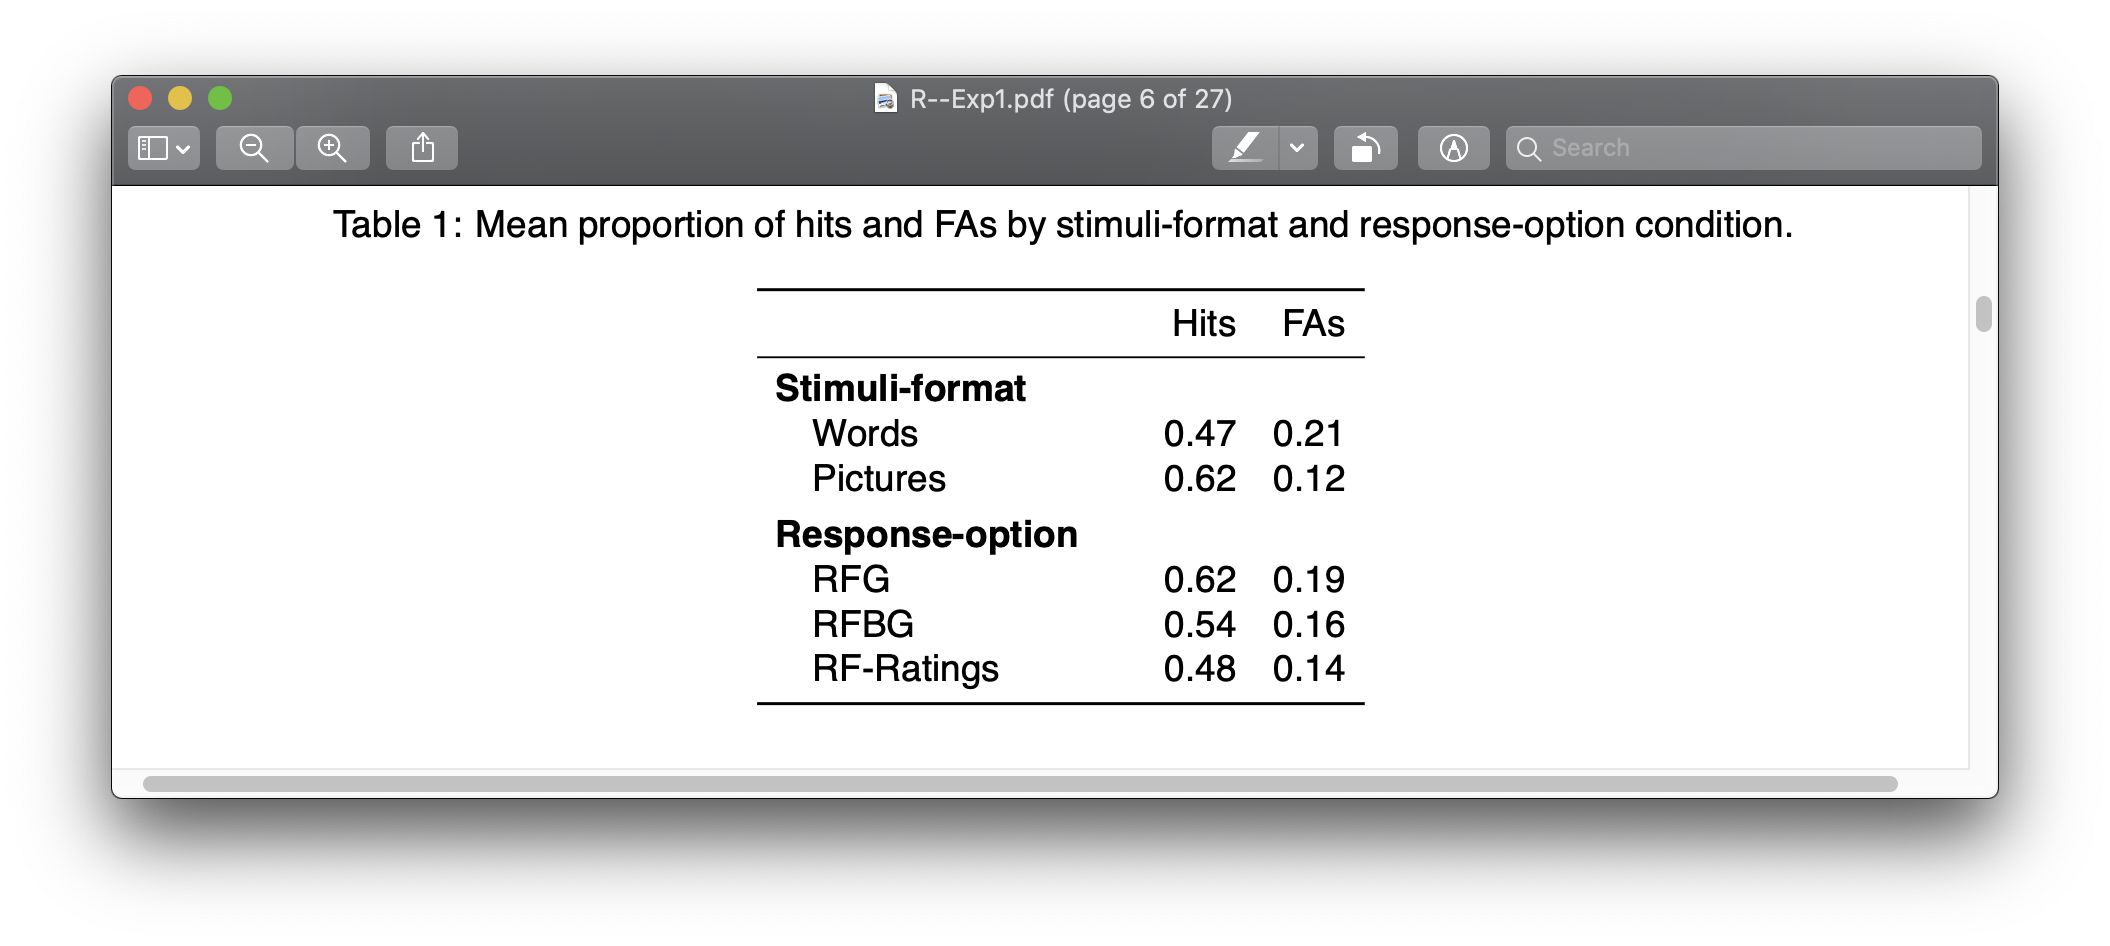
3. It can output correctly formatted tables with ease:
I don't think I'm alone when I say I loathe making tables in Word. It always starts off well, but when you start to mess with the width of columns or group rows into sections, it almost always devolves into a battle with the snap-to-grid features, and it's just generally a nightmare to get the table looking how you want. And don't even think about making any changes above the table if you want the formatting to stay the same. Ugh.
In RMarkdown, tables are a breeze.
Pretty much all of your customisation options can be 'locked-in' using a number of tiny code snippets during the creation of your table.
Keep your table in a certain place relative to other parts of your document:
kable_styling(latex_options = "hold_position")
Display your table as big as possible without extending into document margins:
kable_styling(latex_options = "scale_down")
Put your big table on a landscape page of its own:
landscape()
Do all of the above:
    kable_styling(latex_options = c("hold_position", "scale_down")) %>%
    landscape()
It's so easy to get your table looking how you want, and it's freeing to know that its formatting isn't going to change just because you make changes elsewhere in the document.
Of course, the values found in your tables can also be piped in directly from your data or analysis, which means you only have to create them once. If you make any changes to your data - the values in your table will automatically update!
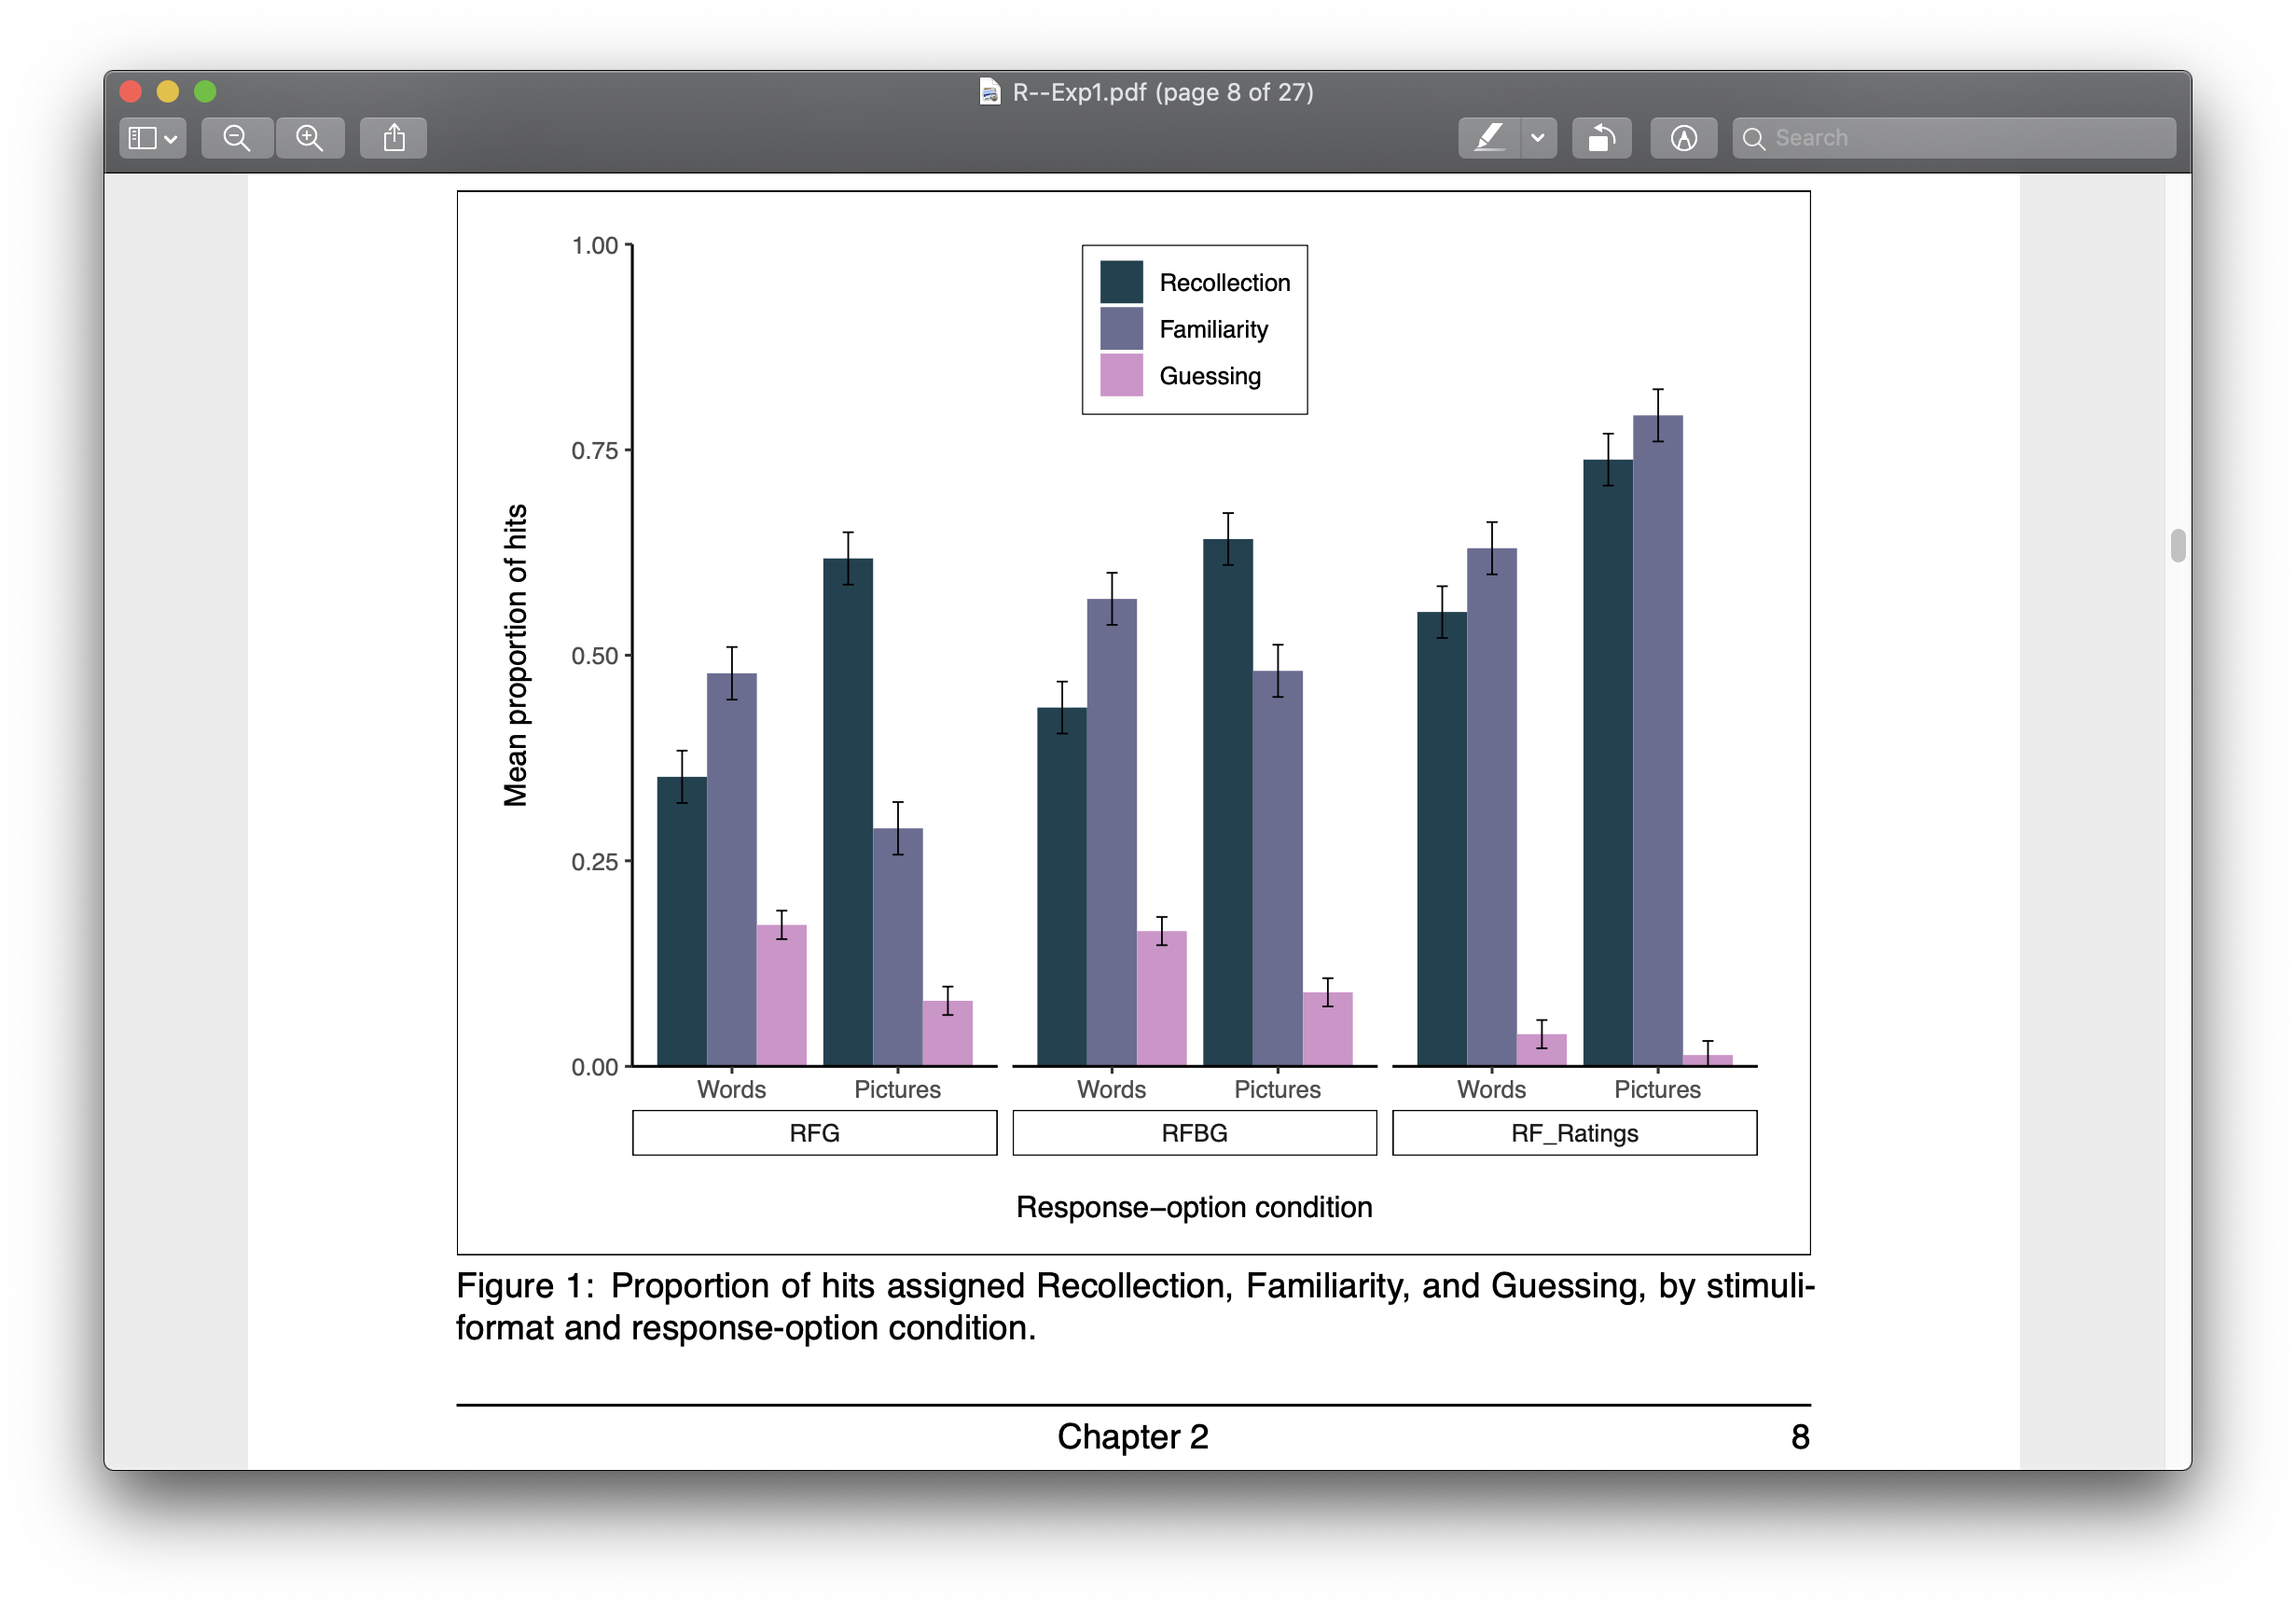
4. It's great for all types of figures:
All of the advantages that apply to tables apply to figures too. You can easily 'lock-in' your formatting with simple code snippets, and your figures are built directly from the data. You'll never need to do tedious things like manually looking up the values for your error bars again!
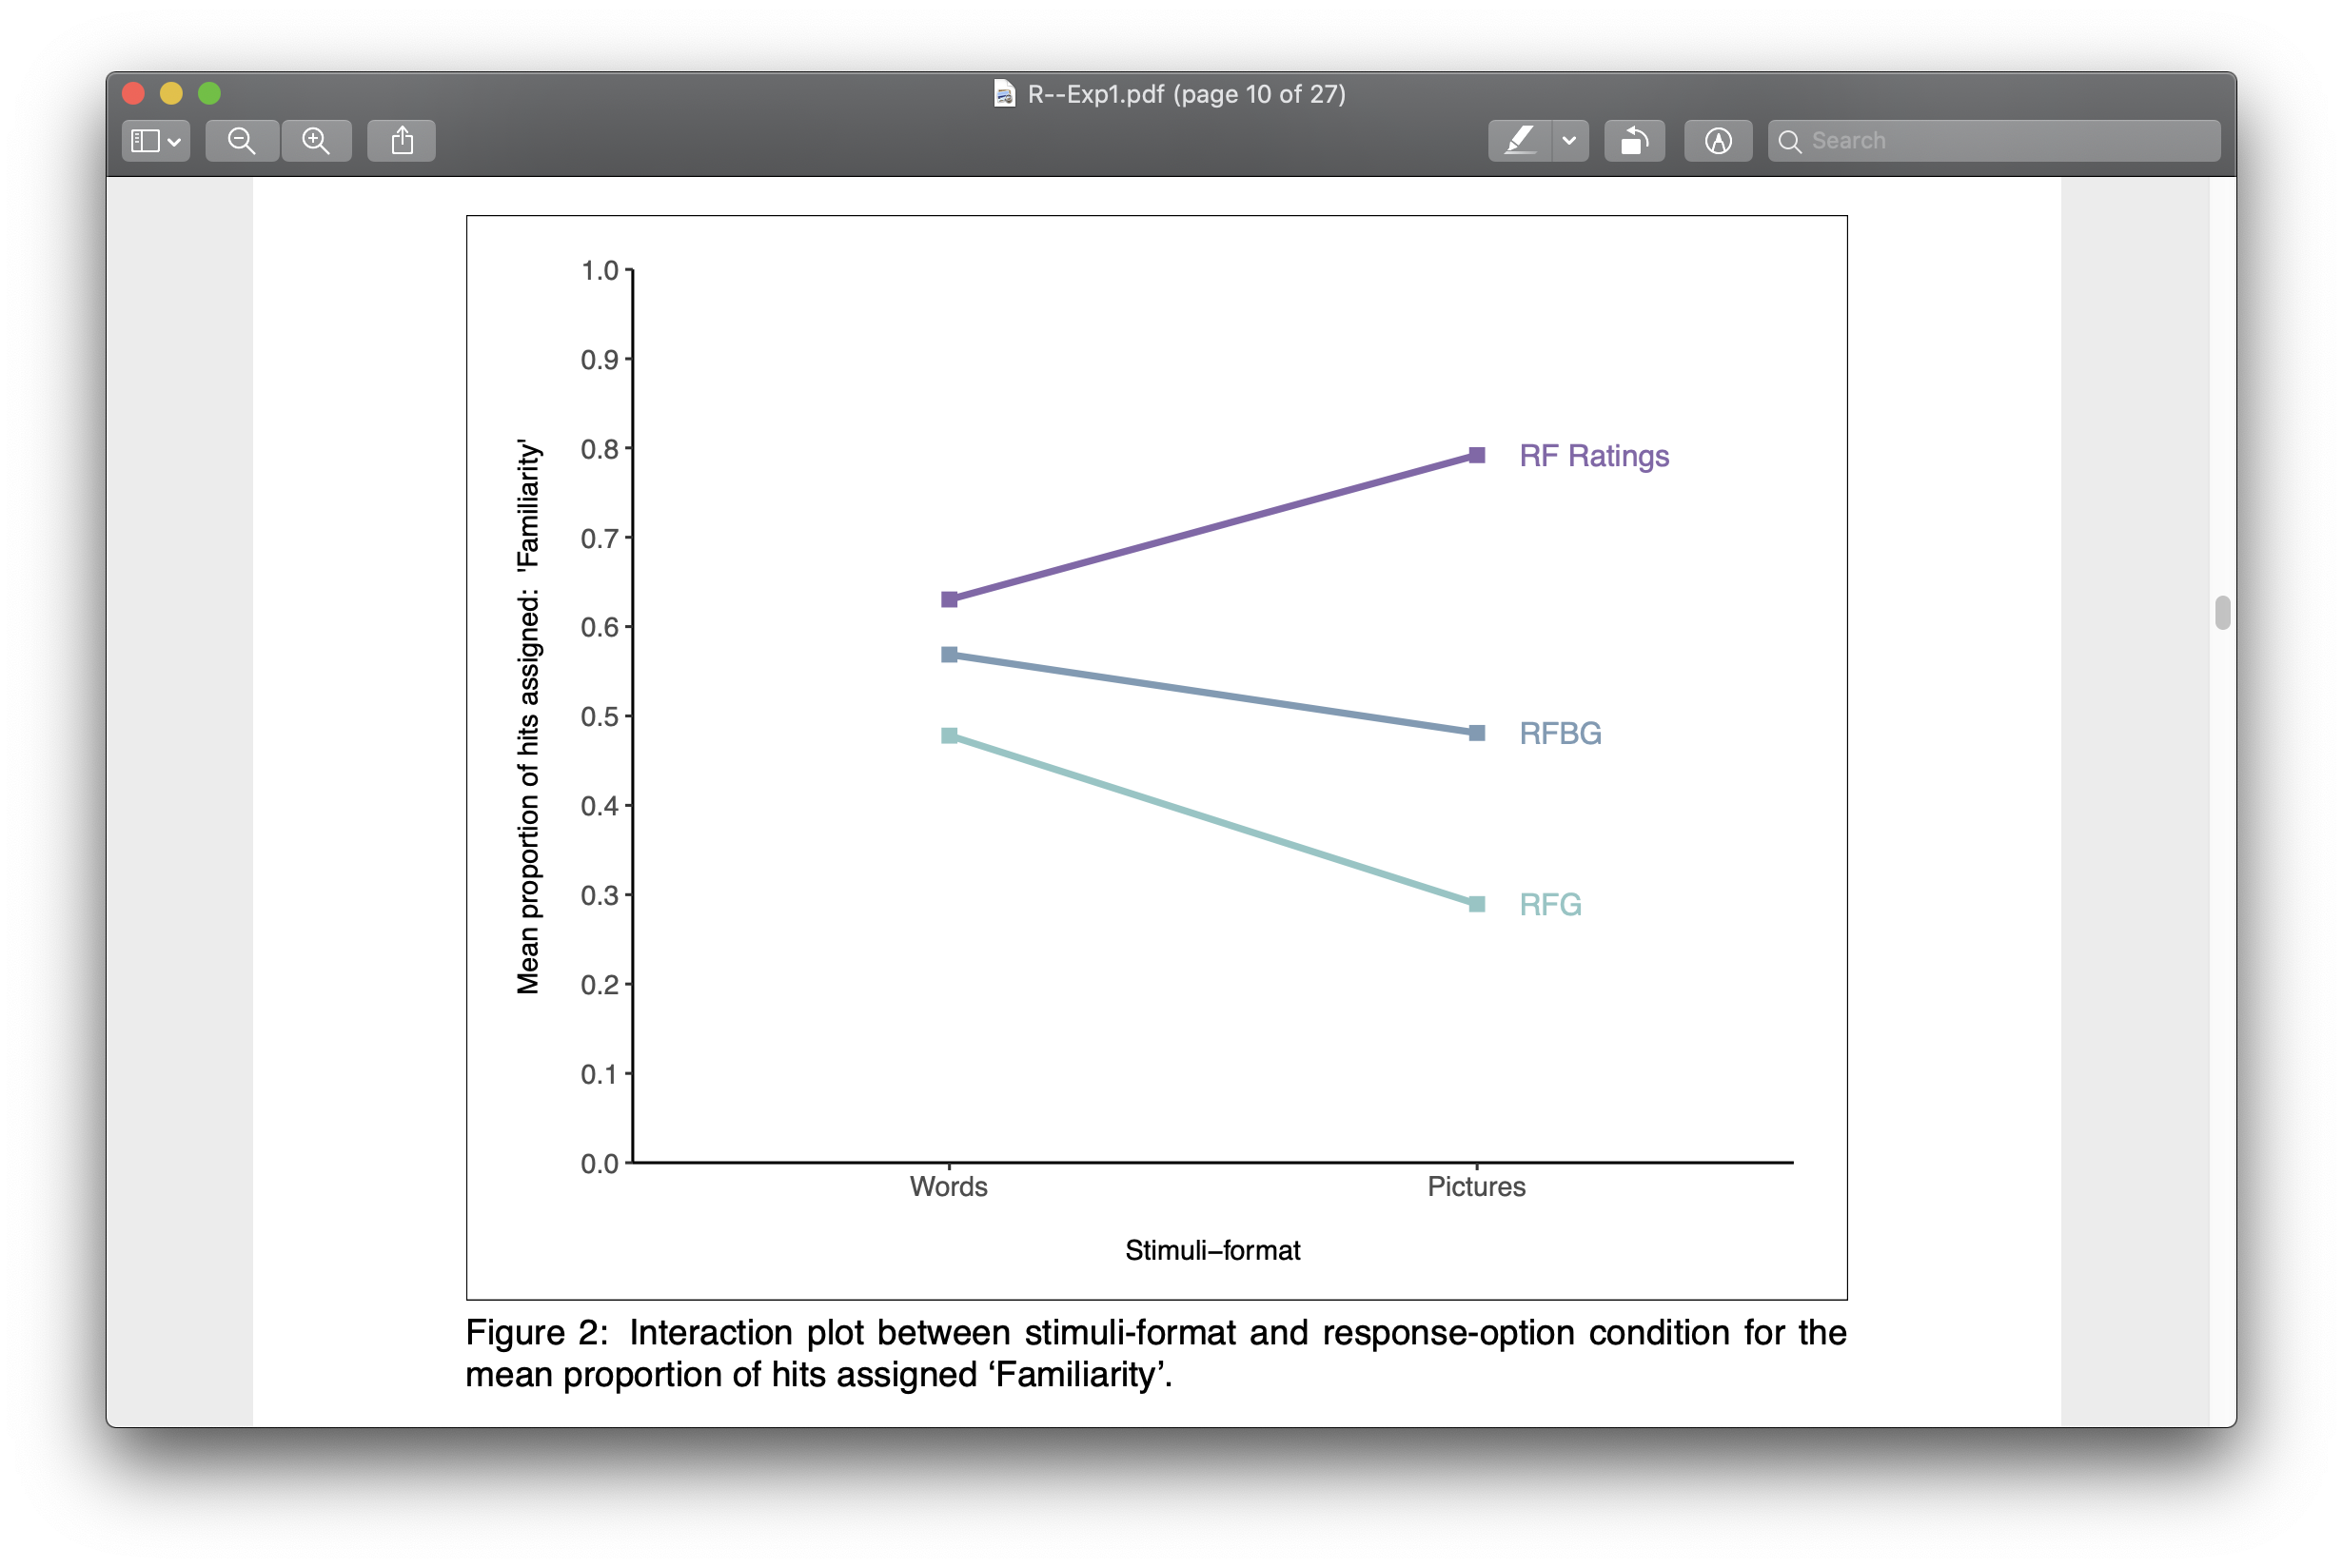
If you're wondering whether you'll be able to create the specific type of figures you need...you almost certainly can. Have a scroll through this great resource from Harvard to get an idea of types of figures you can create easily with "ggplot2".
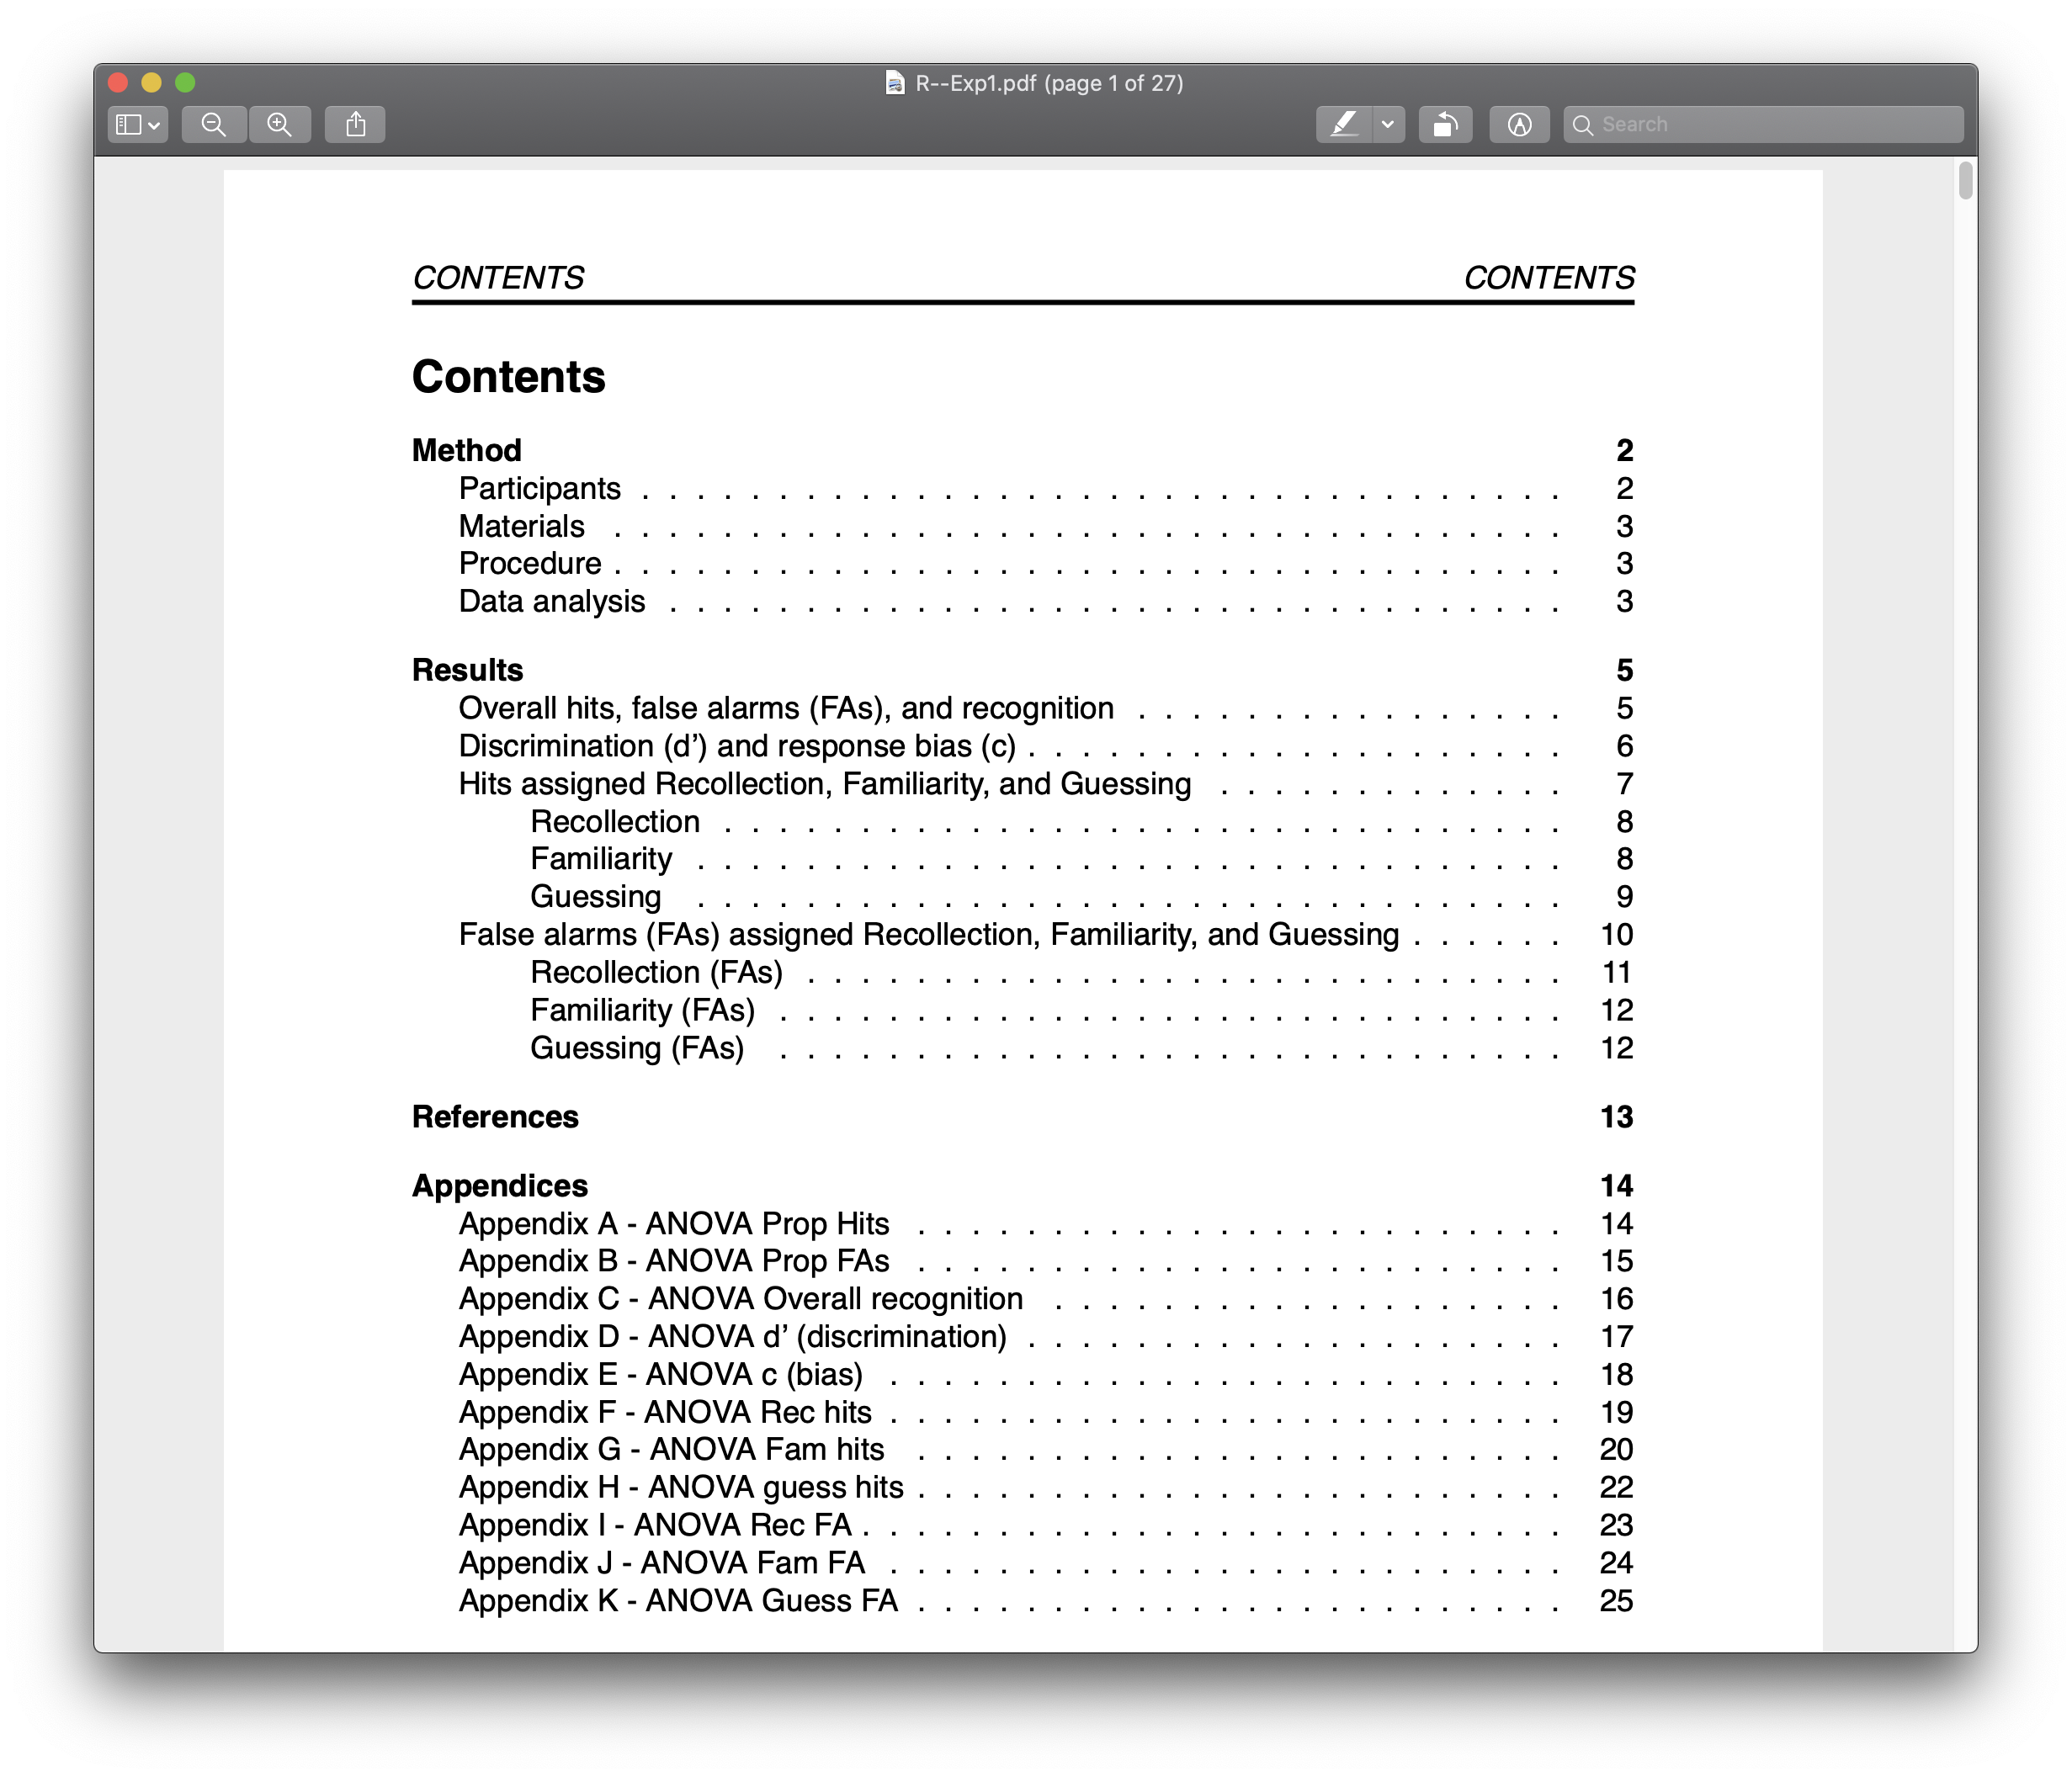
5. It does contents, footnotes, and table/figure captions for you:
Contents: To get a Contents section that automatically updates throughout your entire document, it's as easy as adding:
toc: true
Done!
You can number your sections just as easily. If you change the order of your sections, it'll keep track of this and update the numbering accordingly:
    toc: true
    number_sections: true
Footnotes: To make footnotes, we simply add some info in curly brackets in-text like this:
...websites such as \href{https://www.prolific.co/}{Prolific Academic}
The first set of curly brackets contains what we want in our footnote. The second set contains what we want to show in-text:
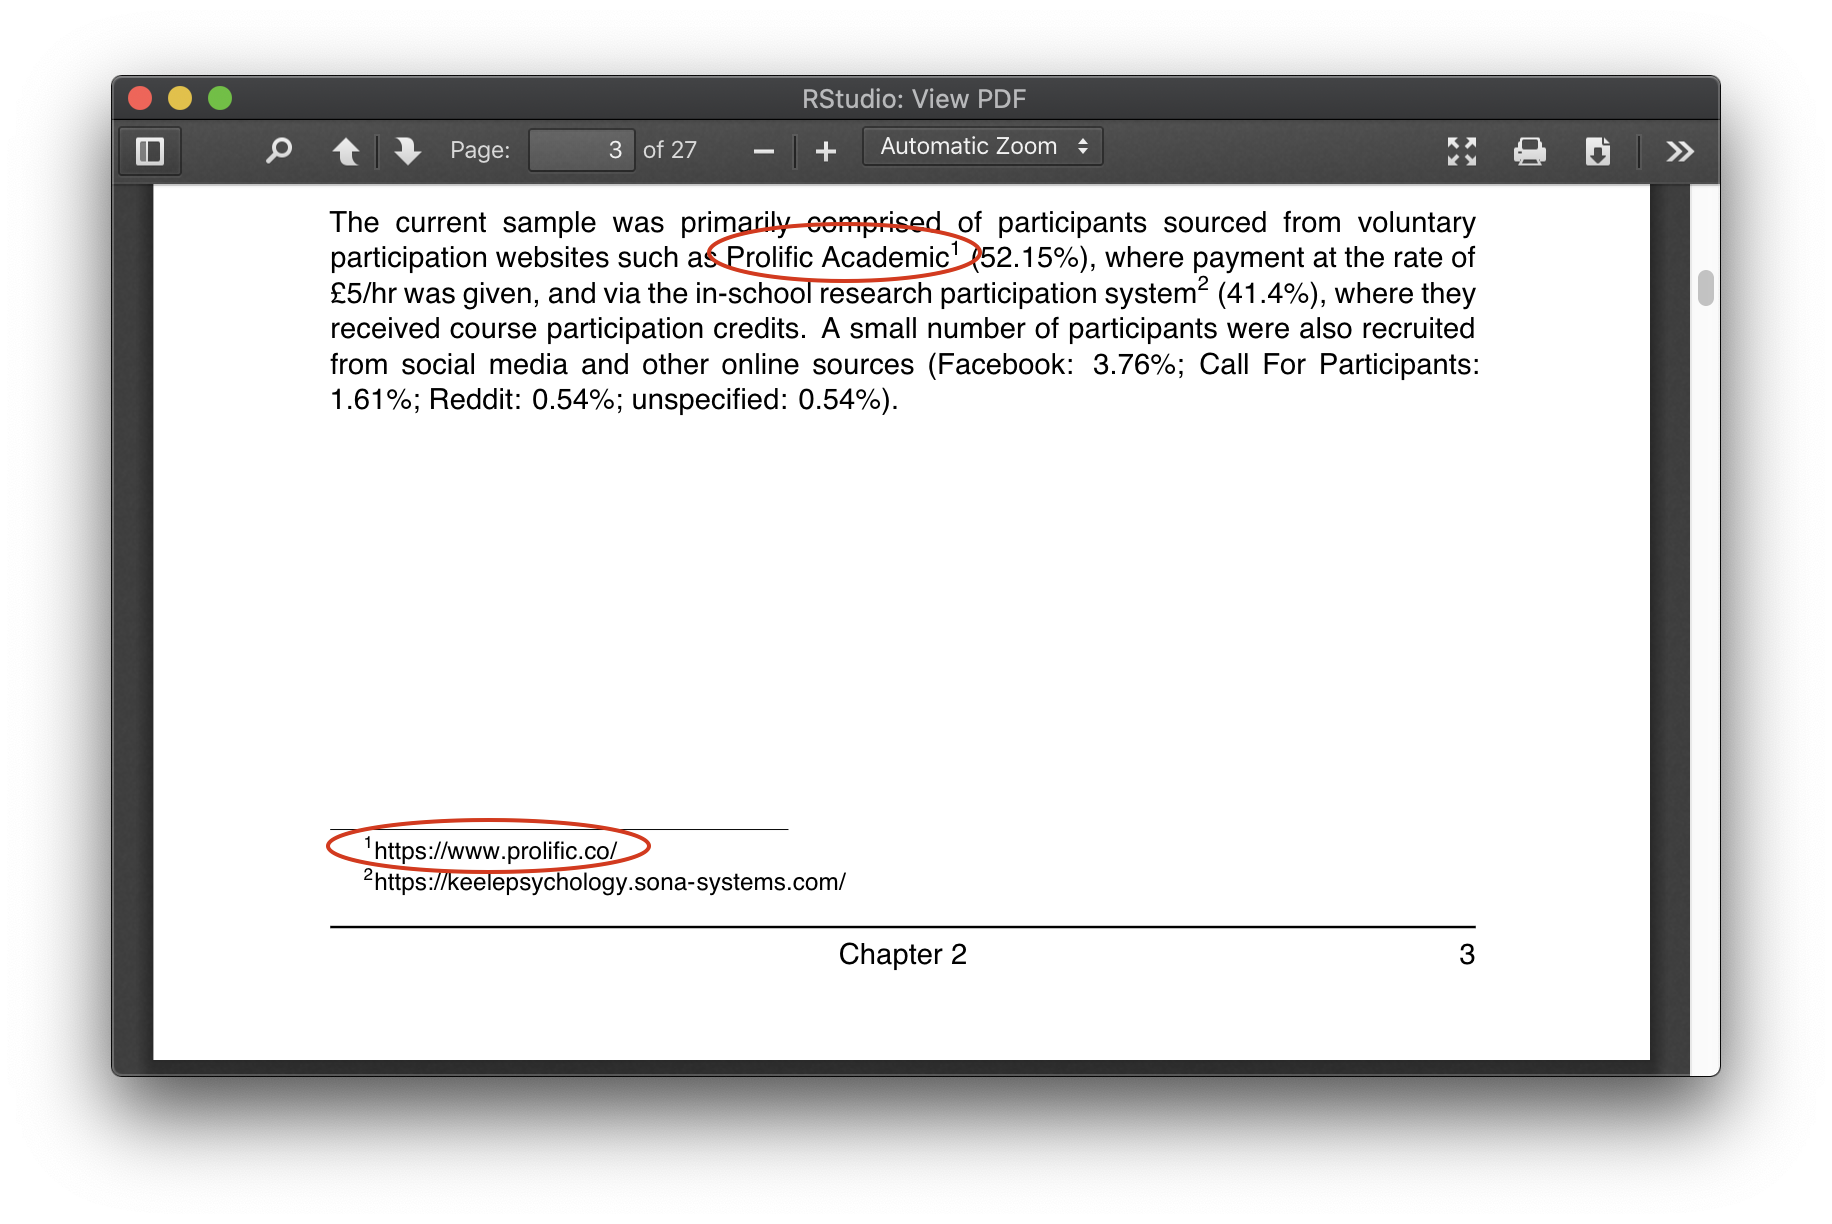
This is great for URLs that you don't want to clutter your paragraph with. They will be automatically numbered for you.
Table and figure captions: By using a package called "captioner", we can define the captions for our tables and figures together in one place (usually at the start of the document). We then 'call' them in at the appropriate points in our document (next to tables and figures). The advantage of this, is that "captioner" will figure out the numbering of these captions (whatever table is first will be "Table 1. Appropriate caption" etc.). This means we can move our tables and figures around whenever we like, without having to worry about messing up the numbering of the captions! It also knows that table captions go above the table and figure captions go below the figure (in APA, at least), and puts the in the approprate place.
Conclusion
Hopefully this article has made you at least a little tempted to try writing documents using R! The normally tedious or frustrating things we have to do in Word / Google Docs can easily be automated in R, so we never have to worry about them again. Is it a scary idea at first? Sure. But it's absolutely worth it.